Quantcast
Channel: General – Esri Australia Technical Blog
Viewing all 274 articles
Browse latest View live

Understanding Spatial References in Australia

$
0
0

GIS data must accurately represent real-world locations to be useful. To do this, you need a standard framework for defining location – a coordinate system. All spatial data utilises a coordinate system to position itself relative to your map and other data. However, coordinate systems are frameworks. They are models, spheroids, imperfect approximations of the shape of the Earth with all its bumps and curves as it changes with time. When working with spatial data you need to consider how a GIS positions this data against reality using coordinate systems.

By better understanding coordinate systems, you will be able to manage your data in a way that increases the accuracy of your maps and the work that you do with them. This blog is the first in a series taking a closer look at using Australian spatial references in ArcGIS. We will start by looking at geographic coordinate systems, projections, and transformations.

Geographic Coordinate Systems

A geographic coordinate system (GCS) provides a framework for identifying locations on a 3D globe. The globe is referred to as a spheroid or ellipsoid. A GCS is a spherical model that plots data in latitude and longitude, with units in decimal degrees or degrees, minutes, seconds.

Latitude and longitude values are angles measured from the earth's center.
Latitude and longitude are angles measured from the earth’s center

To effectively define this framework, representations known as datums are used to place the model against a collection of known control points. If the spheroid is an approximated shape of the earth, the datum is the positioning of the spheroid relative to either local intersection points or the center of the earth.

Common geographic coordinate systems commonly used in Australia are:

  • GDA2020: The Geocentric Datum of Australia 2020 became the national geodetic datum for Australia in December 2017
  • WGS1984: The underlying GCS to the de facto web GIS projection Web Mercator. Used by ArcGIS Online, Google, Bing and Open Street Maps.
  • GDA94: The Geocentric Datum of Australia 1994, the official geodetic datum before GDA2020.

Other coordinate systems include AGD66 and AGD84 which have been superseded by GDA94, and now GDA2020.

Projected Coordinate Systems

Using a curved globe to represent the earth is not a practical solution for most applications. Paper maps and computer screens are flat. A projection is how you display your data on a flat surface. Mathematical calculations are used to convert the curved surface of the GSC to a flat surface.

The MGA Zone 55 projection of GDA94 geographic coordinate system transposes it to a flat surface.
Note the removal of the globe/curve, change from degrees to metres, and distortion to the west and east.

Since there is no perfect way to transpose a curved surface to a flat surface without some distortion, various map projections exist that preserve different properties. It is not possible to preserve the shape, area, distance, and direction of features over a large area. Therefore, it is generally considered that there is no perfect map projection, only the most suitable projection for an application. The extent, location, and property you want to preserve must inform your choice of map projection.

External Content: Why all maps are wrong. Credit: Vox

Every projected coordinate system has an underlying geographic coordinate system. Some example projections of the GCS commonly used in Australia are:

  • GDA2020 MGA Zones (multiple zones are used across Australia)
  • GDA2020 New South Wales Lambert
  • GDA2020 Vicgrid
  • WGS1984 Web Mercator (auxiliary sphere)
  • GDA94 MGA Zones*
  • GDA94 New South Wales Lambert
  • GDA94 Vicgrid

*The difference between MGA94 and MGA2020 Easting and Northing coordinates is approximately 1.5-1.8 metres and simply reflects the projected differences between the GDA94 and GDA2020 latitudes and longitudes.

General overview of MGA Zones in Australia

Geographic transformations

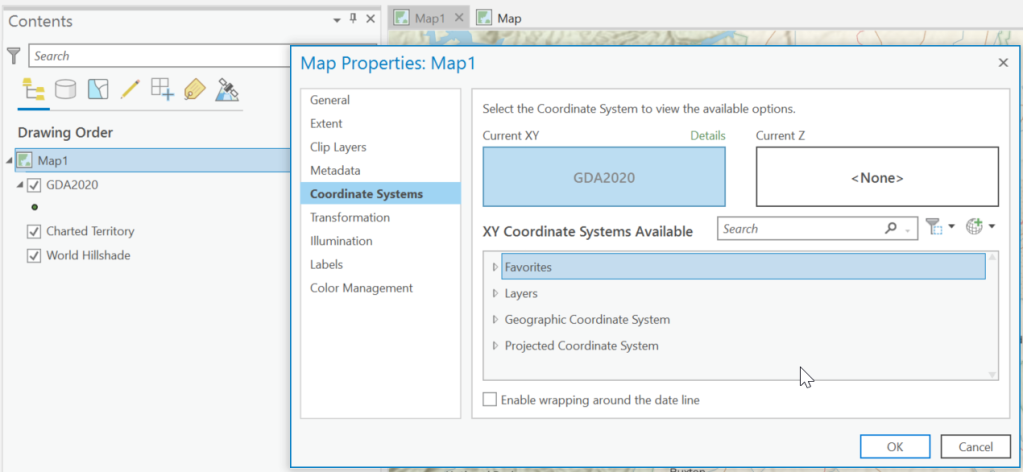
Any spatial data you work with is associated with a particular GCS. ArcGIS Pro can project data between spatial references on-the-fly when you add them to your map, if there is a difference between the data and map spatial references. This works when the data shares the same GCS, such as the projected coordinate systems GDA2020 MGA Zone 56 and GDA2020 New South Wales Lambert. Datasets based on different GCS may not line up properly when you work with them together. This commonly arises in two scenarios:

  • The data is not projected but has a different GCS to your other data.
  • The data is in the same PCS as your other data, but the GCS is different.

If you are working with datasets that are based on a different GCS, you should set a geographic, or datum, transformation. This can be applied on-the-fly in ArcGIS, or at the source data to help minimise error.

Many Australian users are familiar with one transformation method – GDA94 to WGS 1984 – to facilitate web GIS workflows. GDA2020 introduces some additional considerations when applying transformations:

  • There are three transformation methods between GDA2020 and GDA94. The typical install of ArcGIS Pro includes the WGS1984 to GDA2020 7-parameter transformation. Additional installation steps are required to include the two additional conformal and distortion grid-based transformation methods in ArcGIS Pro.
  • There is no direct transformation method between GDA2020 and WGS1984. A composite transformation method exists but there are some considerations around the Web Mercator dilemma.

 Which spatial reference should I use?

These posts are not intended to make any recommendations around what coordinate systems or transformations between them you should be using. This is a contextual requirement and will differ between readers. 

Most organisations or projects will have a nominated spatial reference that you store and display data in. For example, a Sydney based infrastructure I worked on in the 2010’s had the projected coordinate system GDA 94 MGA Zone 56 set as the standard. Any incoming project data would be converted to this spatial reference as part of the process to bring it into our project geodatabases. Any map we produced would be set to this reference. However, this reference would not be suitable for projects entering other zones or with the modern shift to GDA2020.

In choosing a spatial reference, consider:

  • What is the organization and project standard?
  • Are there any external requirements, such as government standards?
  • Is it suitable for your project extent?
  • What characteristics are distorted with the projection?
  • Could it be stored as a GCS only, and projected-on-the-fly as required?
  • Will there be scenarios where the data is used with a different GCS, such as in a Web GIS context?

Ultimately it is important to understand what spatial reference your data is stored in and how it is being handled or portrayed in GIS.

Moving to GDA2020 and looking for a strategy built on a thorough analysis of your requirements? Find out more about Esri Australia GDA2020 service packages and book a free consultation here.

Continue reading:

  1. Understanding Spatial References in Australia (current page)
  2. The introduction of GDA2020 to ArcGIS and how to install the additional transformation methods
  3. Working with coordinate systems and transformations in ArcGIS Pro
  4. GDA2020, ArcGIS Online and the Web Mercator Dilemma


Introduction of GDA2020 to ArcGIS and how to install the additional transformation methods

$
0
0

Australia has recently moved towards a new datum, the Geocentric Datum of Australia 2020 (GDA2020), to facilitate a more robust, accurate and capable datum that is more closely aligned with the expectations of a modern, connected Australia.

The introduction of a new datum impacts all areas of the software. Esri support for GDA2020 was progressively added as the datum parameters and associated transformation methods were released. All current releases of ArcGIS Pro (2.2 onward) and ArcGIS Desktop (10.6.1 onward) now support GDA2020, the associated projections, and transformations between it and GDA94.

An additional installation is required to support the NTv2 grid-based transformation methods released for GDA94-GDA2020.

GDA94-GDA2020 transformations

As you move towards adopting GDA2020 there will be scenarios where you will need to work with data based on GDA94 and or GDA2020 geographic coordinate systems (GCS). As these datums are different the same location on the ground will have different coordinate values in the other GCS. If you are working with both GCS in one map, or, if you are looking to project your source data between the two, you will need to use a geographic transformation.

Remember – projected coordinate systems will have an underlying geographic coordinate system!

A geographic transformation is an operation that converts the coordinates of a point in one geographic coordinate system to the coordinates of the same point in another geographic coordinate system.  ArcGIS Pro includes a mathematical seven parameter similarity transformation between GDA2020 and GDA94 out of the box, with two additional grid-based transformation methods available as a separate installation through My Esri. Once installed there will be three transformation paths available:

  • GDA 1994 To GDA 2020 1*
  • GDA 1994 To GDA 2020 NTv2 3 Conformal**
  • GDA 1994 To GDA 2020 NTv2 2 Conformal and Distortion**

Transformation paths apply both to and from the specified geographic coordinate systems.
*Seven parameter similarity transformation
**Additional grid-based transformation methods available through a separate installation. Some parts of the ArcGIS Platform will only support the transformation methods available by default.

A grid-based transformation method can be very accurate in modeling small changes between two geographic coordinate systems. Grid files can be reasonably large. The ICSM released two 2D national transformation grids as follows:

  • Conformal: A grid version of the seven parameter similarity transformation. The basic difference between GDA94 and GDA2020 coordinates primarily due to plate tectonic movement (approximately 1.7m NNE over 26 years); and
  • Conformal + Distortion: Incorporates the conformal seven parameter similarity transformation plus localised and regional distortion revealed by incorporating coordinates on the ground survey control networks across the nation.

Installing the grid-based transformation methods

Due to the size of the NTv2 grid-based transformation method, they are not included in the default installation. They are available as a separate installation downloadable from My Esri:

My Esri > Downloads > Products > ArcGIS Pro (select version* and then view downloads) > Data and Content > ArcGIS Coordinate Systems Data

*It is important to select the correct version of ArcGIS software installed as there have been changes between each release, and early versions of ArcGIS Desktop do not support GDA2020.

If you don’t have access to downloading software through My Esri you can request permissions to download, reach out to your organisation’s IT or GIS administrators, or contact Technical Support.

Proceed through the installation wizard accepting all defaults until the Select Features step. Here you may change the installed features so that only the NTv2 method files are installed, saving disk space:

During ArcGIS Coordinate Systems Data Setup click the icons to only apply the files needed for GDA2020-GDA94 NTv2 methods

Silently installing the grid-based transformation methods

For scripted and automated installations or deployments you can call on the unpacked installation files with additional parameters, such as only selecting the NTv2 method files for install:

  1. In My Esri, download the ArcGIS Coordinate Systems data for the appropriate ArcGIS release.
  2. Run the downloaded .exe to unpack the installation files (choosing a folder as necessary).
  3. Run one of the following commands with the necessary user privileges and path amended to where the files were extracted in step 2:
  • For a silent install with no progress bar or confirmation and only NTv2 files:
    • <path_to_extracted_files>\CoordinateSystemsData\SetupFiles\CSD.msi  /qn ADDLOCAL="NTv2"
  • For a silent install with progress bar and simple GUI with no options or clicks:
    • <path_to_extracted_files>\CoordinateSystemsData\SetupFiles\CSD.msi  /passive ADDLOCAL="NTv2"

Support in earlier versions of ArcGIS

Esri support for GDA2020 was progressively added as the coordinate system and associated transformation methods were released. The versions of ArcGIS Pro and ArcMap discussed below are in mature or retired support. If you are on one of these versions, you should consider upgrading to a more recent release.

  • ArcGIS 10.5 and ArcGIS Pro 2.0 introduced the GDA2020 GCS. It became visible under Coordinate Systems and allowed new data to be collected within this spatial reference. However, the transformation methods were not available at the time, and existing data could not be projected to GDA2020.
  • ArcGIS 10.6 and ArcGIS Pro 2.1 introduced the mathematical seven parameter similarity transformation. ICSM also developed two 2D national transformation grids for GDA94-GDA2020 that were not released with the software. They could be manually included by downloading the grid files, renaming them, and placing them into the appropriate product directory.
  • With ArcGIS 10.6.1 and ArcGIS Pro 2.2, Esri now includes GDA2020 as a coordinate system and supports GDA2020 NTv2 grid files through a separate ArcGIS Coordinate Systems Data installer.

Do not downloading and rename the grid files manually for recent ArcGIS releases.

GDA2020 is not supported in earlier versions of ArcGIS except for the ArcGIS 10.2.1 utility release.

Moving to GDA2020 and looking for a strategy built on a thorough analysis of your requirements? Find out more about Esri Australia GDA2020 service packages and book a free consultation here.

Continue reading:

  1. Understanding Spatial References in Australia
  2. The introduction of GDA2020 to ArcGIS and how to install the additional transformation methods (current page)
  3. Working with coordinate systems and transformations in ArcGIS Pro
  4. GDA2020, ArcGIS Online and the Web Mercator Dilemma

Working with Coordinate Systems and Transformation in ArcGIS Pro

$
0
0

When you work with spatial data in ArcGIS Pro, you add datasets as layers to a Map. The map has a defined spatial reference, and this is what ArcGIS Pro uses as it attempts to align your data to the map. It is important to understand how this behaviour works, how to ensure your data in a different Geographic Coordinate System (GCS) have correct transformations applied, and what options are available to change default behaviours.

ArcGIS Pro Maps and Default Spatial References

By default, Maps in ArcGIS Pro will use the spatial reference of the first operational layer added. This means the first layer that is not a basemap sets the coordinate system for maps and local scenes. Before any layers are added, the map is soft set to use the basemap coordinate system. For Esri basemaps, this means WGS1984 Web Mercator (auxiliary sphere). Subsequent layers added after the first will not continue to change the map’s chosen spatial reference.

This is a change in behaviour to ArcMap, where the data frame coordinate system would be ‘undefined’ until the first operational layer was added. This often resulted in features and feature classes being created without any spatial reference defined, a significant challenge for spatial data management.

You can use the ‘Choose spatial reference’ option to specify a different default coordinate system (ArcGIS Pro Options > Application, Map and Scene > Spatial reference). Note that the coordinate system setting does not apply to global scenes, because they only use WGS1984 or CGCS2000.

ArcGIS Pro Options can be used to change the default behaviour for new maps.

ArcGIS Pro reprojects data on-the-fly that does not match the spatial reference of the map. For non-projected and projected layers sharing the same GCS, it is generally able to do this without issue. When you add a layer with a different geographic coordinate system a warning will appear that a transformation is required to align your data sources correctly.

If you do not see this warning it may be a result of:

  • Only one transformation exists between the data GCS and map GCS, and ArcGIS Pro has automatically chosen this option. You can identify and edit which transformations are currently applied under the Map properties. You can also add transformations for a GCS not currently used in the map.
  • You have previously chosen to ignore this warning. It can be re-enabled in ArcGIS Pro Options > Application, Map and Scene > Spatial Reference > ‘Warn if transformation between geographic coordinate system is required to align data sources correctly’.

If you are working with a mix of GCS and do not have a transformation applied it may lead to data misalignment.

Working with existing maps

You can readily identify or change the coordinate system currently used by the map by right-clicking the map name in the ArcGIS Pro Contents Pane and going to Coordinate Systems:

Change the coordinate system of the map under the Map Properties

To change the spatial reference for your map, select from the XY coordinate systems available. All available coordinate systems are split into geographic or projected coordinate systems. A search tool is available. You can also save any commonly used coordinate systems by right-clicking them and choosing to add to favourites.

Don’t forget each Projected Coordinate System has an underlying Geographic Coordinate System!

Coordinate systems used by layers currently in the map will also be displayed. You can use these to easily match the Map coordinate system used against a layer. It’s also useful to check what coordinate systems are being used and ensure then transformations are applied as necessary:

The Map Properties Coordinate Systems tab shows coordinate systems currently used by layers in the map.

To see what transformations are being applied you can move to the Transformations tab in the Map Properties Pane. Remember that transformation paths work in both directions, so the ‘GDA1994 to GDA 2020 1’ transformation will align your GDA94 GCS to GDA2020 maps and vice versa. You can also specify the transformation being used between GCS that have multiple.

From ArcGIS Pro 2.7 you can now add additional transformations. These may not be currently used in the map, but can be saved for future use

ArcGIS Pro 2.7 allows you to specify additional transformation methods not currently used in the map

Working with spatial data sources

To adhere to organisational standards and to minimise errors while editing or performing analysis, it is good practice to transform the datum in the source data. This step is commonly performed when bringing data into your file or enterprise geodatabases.

You can identify the spatial reference of a layer in your Content or Catalog pane by right-clicking the item > Properties > Source > Spatial Reference. Remember that projected coordinate systems will list both a projected coordinate system and its underlying geographic coordinate system.

For data sources with an incorrect or unknown coordinate system defined you can use the Define Projection tool to modify the coordinate system of the layer. When using this tool note take caution and note:

  • You must know the correct coordinate system of the dataset before using this tool.
  • The tool updates the input data (Most geoprocessing tools create an output. This does not).
  • The Define Projection tool only updates the existing coordinate system information. It does not modify the geometry of the input data; it does not project or transform it into a new coordinate system.

You can use the Project tool to project spatial data from one coordinate system to another. The tool will create an output, meaning your original input data will not be modified and you will have two copies of your data. When running the tool, it will interpret the spatial reference of your input data and you can choose the output spatial reference. The tool’s Geographic Transformation parameter is optional. When no geographic or datum transformation is required, no drop-down list will appear on the parameter, and it is left blank. When a transformation is required, a drop-down list will be generated based on the input and output datums, and a default transformation will be selected. You can change the transformation path as desired.

For example, projecting from GDA94 to GDA94 MGA Zone 56 does not require a transformation as the same GCS is used for both. GDA94 MGA Zone 56 to GDA2020 MGA Zone 56 would require a transformation to be selected as the underlying GCS is different.

Running the Project tool will project input data into a new output. Transformations can be included when the coordinate systems have a different underlying GCS

Which transformation do I pick?

These blogs are not intended to make recommendations on coordinate systems or the transformations between them. The appropriateness may differ depending on your data, organisational and workflow needs. Esri Australia GDA2020 service packages offer a strategy and workplan built on a thorough analysis of your requirements.

Some key technical concepts to note at the time of writing:

  • The grid-based transformation methods can be very accurate in modelling changes between two geographic coordinate systems.
  • The appropriate NTv2 transformation grid to use between GDA2020 and GDA94 differs depending on the jurisdiction and the accuracy and lineage of the dataset being transformed.
  • Currently GDA2020 reference systems are defined in relation to GDA94 only. As a result transforming between other coordinate systems, such as WGS 1984 or Vicgrid GDA94, to GDA2020, may require an additional transformation – a ‘composite transformation’. This brings further considerations and complications.
  • Composite and grid-based transformation methods are not supported in all parts of the ArcGIS platform. Data may need to be projected using the Project tool prior to use.

Moving to GDA2020 and looking for a strategy built on a thorough analysis of your requirements? Find out more about Esri Australia GDA2020 service packages and book a free consultation here.

Continue Reading

  1. Understanding Spatial References in Australia
  2. Introduction of GDA2020 to ArcGIS and how to install the additional transformation methods
  3. Working with coordinate systems and transformations in ArcGIS Pro (current page)
  4. GDA2020, ArcGIS Online and the Web Mercator Dilemma

GDA2020, ArcGIS Online and the Web Mercator Dilemma

$
0
0

In ArcGIS Online Map Viewer, all layers in a web map inherit the coordinate system of the basemap. WGS 1984 Web Mercator (auxiliary sphere) is the spatial reference of basemap services in the default Esri basemap gallery, meaning this is the default web GIS coordinate system. Layers also have their own spatial reference and transformations defined at a service level. When you add layers to the Web Map Viewer, an on-the-fly reprojection is performed to align your data with the coordinate system of the basemap.

When publishing data to web GIS you need to consider what spatial reference will be used to store the data at a service level, how the publishing process may affect it, as well as what transformations (or lack of) will be applied when the layer is displayed in a web map with a different geographic coordinate system (GCS).

It is also important to understand GDA2020 and its relationship with web GIS. The de facto WGS84 in web GIS brings some challenges not unique to Australia or ArcGIS. Failing to address these challenges may result in data misalignment.

The Web Mercator Dilemma

During the early 1990s, the governing bodies defining the transformation parameters between GDA94 and WGS84 set the transformation as ‘null’. At this period both GDA94 and WGS84 were considered coincident as they were based on the same spheroid, with essentially the same origin. That ‘Null’ parameter now creates a problem when projecting GDA2020 data to WGS84 Web Mercator as the differences between GDA94 datum (a static datum) and WGS84 (effectively, a dynamic datum) have increased over time. Although this has not presented significant issues to the end-user as data mapped in web maps typically had low accuracy – this is changing.  Essentially, the problem presents itself as a misalignment of GDA94 or GDA2020 data when viewed in a WGS84 based projection.

Unfortunately, with the modernisation of the Australian datum to GDA2020 there is not a definitive relationship between GDA2020 and WGS84. The following diagram gives a representation of the relevant issue:

There is no transformation between GDA2020 and WGS84 directly. A composite transformation is available of WGS84 to GDA94 and GDA94 to GDA2020. This introduces challenges where a composite transformation is not allowed, such as applying transformations to mosaic datasets.

Data in the web map environment can be displayed against Esri basemaps and web scenes and other WGS84-based data. In most instances this will not be an issue as the generic basemap data is derived from many sources with varying positional accuracies. From a user data perspective on GDA2020 Esri Australia recommends:

  • Create your own basemap in GDA2020 and use layers published in GDA2020.
  • If publishing for use in WGS84, project the data first using GDA2020 > GDA94 > WGS84. Data will be published with GDA94 accuracy and coordinate transformations between WGS84 and GDA94 can be performed.
  • Do NOT mix GDA94 and GDA2020 data in a web GIS as there will be a 1.8m alignment error. Transform all data to GDA2020 and republish to Web GIS in GDA2020 or a GDA2020-based projected coordinate system.
  • If a coordinate conversion is required in Web GIS from WGS84 to GDA2020 then a transformation path of WGS84 > GDA94 > GDA2020 should be utilised.

Publishing Hosted Feature Layers from ArcGIS Pro – Coordinate Systems and transformations at a service level

Layers added to the ArcGIS Online Web Map Viewer and Scene Viewer will be reprojected on the fly to line up with the basemap. But what coordinate system is stored against the layer being added, and what transformation is being applied? This is dictated by the coordinate system and transformations set in the Map Properties in ArcGIS Pro at the time of publish. If you publish Hosted Feature Layers with a different geographic coordinate system to your Web Map, the data may not align if a transformation cannot be correctly applied.

When you publish a hosted feature layer from ArcGIS Pro, and you know people will use the hosted feature layer in maps that contain ArcGIS Online basemaps, you can do one of the following:

Option 1: Preserve the projection of your data but define a geographic transformation that ArcGIS Online can use when performing on-the-fly reprojections of the hosted feature layer.

With this option, your source data and hosted feature layer data remain in the same projection. You define what geographic transformation should be used when on-the-fly reprojection is required i.e. when you add the layer to a web map with a basemap in a different GCS.

The following steps summarise how to keep your data’s original projection and define a geographic transformation to control how the layer is reprojected when viewed on an ArcGIS Online basemap.

  1. In ArcGIS Pro, open the map you want to publish as a hosted feature layer.
  2. Open the Map Properties and set the data frame’s coordinate system to match the coordinate system of the source data in your map and apply your changes.
  3. In the Map Properties > Transformations, add a transformation. Choose a transformation path between the source data and the expected web GIS spatial references (i.e. to/from WGS84). From ArcGIS Pro 2.7 you can add transformations for GCS not currently in your map – for earlier releases you’ll need to add a layer to include such transformations.
  4. Go to Share > Share As > Web Layer to publish all the layers in the map as a Hosted Feature service in the coordinate system of the Map with the transformations retained.

What this means is you can publish your data in a projection other than Web Mercator, and add a transformation to go from your layer projection into another projection such as WGS84.  When that data is displayed on top of a basemap based on WGS84, it will use the transformation you picked to reproject the data.  This method should work with any transformation that is supported out of the box in Esri’s desktop software.

User-defined/Custom transformations or grid-based transformations that typically require downloading a third-party grid shift database (GSB) are not supported at this time. Please remove them from your data frame prior to publishing to avoid any unexpected issues. This includes the NTv2 grid-based transformation methods for GDA2020 to GDA94

Option 2: Configure the map so that the feature class data is reprojected into WGS 1984 Web Mercator (auxiliary sphere) when it is copied to ArcGIS Online.

With this option, the hosted feature layer data is stored in ArcGIS Online in the same coordinate system as the ArcGIS Online basemaps; therefore, no on-the-fly reprojection is needed when viewed on these basemaps. However, this means the hosted feature layer data and the data in your data source are now in different projections.

The following steps summarise how to configure the map so the publishing process reprojects the hosted feature layer data so it is stored in WGS 1984 Web Mercator (auxiliary sphere):

  1. In ArcMap or ArcGIS Pro, open the map you want to publish as a hosted feature layer.
  2. Set the data frame’s coordinate system to WGS 1984 Web Mercator (auxiliary sphere). This is the projection in which the hosted feature layer data will be stored.
  3. Define a geographic transformation between WGS84 and the GCS of your data source as required.
  4. Publish your layer to ArcGIS Online. As part of the publishing process, your data will be reprojected to match the Map’s projection using the transformation you’ve specified. This method even works if you have your own custom projections and associated custom transformations. Depending on your workflows, though, this method creates some extra steps if you need to merge the published layer back into the original dataset.

Checking the coordinate system and transformations of published layers

To identify the spatial reference of an ArcGIS Online Hosted Feature Layer:

  1. Open the Hosted Feature Layer Item Details page via Content
  2. On the bottom-right of the page click the ‘View’ button next to URL

A new browser page will open showing service details, including the Spatial Reference WKID.

To identify datum transformations stored in the service:

Continuing from the ArcGIS Rest Services Directory above, move to the Admin REST API by adding ‘admin/’ to the browser URL between rest and services.

https://services.arcgis.com/j3JVMGycAs95su2E/arcgis/rest/services/Map1_CC/FeatureServer

to:

https://services.arcgis.com/j3JVMGycAs95su2E/arcgis/rest/admin/services/Map1_CC/FeatureServer

The ArcGIS REST Administrator Directory will have a distinctive red

From the REST Administrator Directory, click the JSON link at the top of the page to view the service definition with any datumTransformation parameters

The Transformations in the ArcGIS Pro Map Properties have carried across to the service

With care, advanced users can use the Admin Service endpoint Update Definition operation to directly update the datumTransformations included in the service definition. The transformations must be supported for Hosted Feature Layers (at this time, no NTv2 grid-based transformations).

Changing the basemap layer, and coordinate system, of your Web Map

In addition to the basemap gallery, you can also use your own basemap by searching for an existing layer or adding a layer from the web. Several layer types are supported. When you use your own basemap, your map uses the coordinate system of that basemap instead of Web Mercator, the coordinate system of Esri basemaps.

The following layer types are supported for custom basemaps: imagery, map image, tile, vector tile, WMS OGC, WMTS OGC, Bing, and OpenStreetMap.

Please see the help documentation to use your own basemap for more information.

Moving to GDA2020 and looking for a strategy built on a thorough analysis of your requirements? Find out more about Esri Australia GDA2020 service packages and book a free consultation here.

Continue Reading

  1. Understanding Spatial References in Australia
  2. Introduction of GDA2020 to ArcGIS and how to install the additional transformation methods
  3. Working with coordinate systems and transformations in ArcGIS Pro
  4. GDA2020, ArcGIS Online and the Web Mercator Dilemma (current page)

Learn Imagery and Remote Sensing in ArcGIS

$
0
0

Ever wanted to understand how ArcGIS can help you leverage Remotely Sensed Imagery, Drone Imagery, Aerial Imagery and Lidar data datasets. Not sure where to start or how to even get access to dataset to get started with?

Well Esri is investing in the Remote Sensing and Image Analysis. It is now core fundamental components of the ArcGIS System. You will see dynamic imagery and raster analytics soon coming to ArcGIS Online

In order to help with you get started in imagery Esri has release an excellent body of materials that step you through the full end to end workflow of imagery, imagery analysis and result presentation.

To access the Introduction to Imagery & Remote Sensing course select

Introduction to Imagery & Remote Sensing

This is broken in five key sections

This site presents a group of materials that Esri is curating and is constantly updating. As technology evolves the topics in this online course will adapt.

New GDA2020 transformations for WebGIS

$
0
0

Esri Australia has been working with Esri and ICSM to ensure that the ArcGIS system can support clients migration from the GDA94 static datum to GDA2020 static datum. The ArcGIS system now fully supports data transformations via 7-parameter similarity transformation, or NTv2.0 transformation Grids.

As a result we are now seeing many clients migrate their authoritative datasets to GDA2020 and requiring all delivered data is in this same static datum. State and national governments are now delivering foundational open datasets in GDA2020 as well

In parallel to this migration we are also seeing more clients taking up WebGIS and delivering data via web services instead of shipping datasets or producing PDF’s. This is enabling a greater uptake web and mobile GIS, providing better informed field operators and getting live data in the hands of people who need it as they need it.

These two waves of change have presented a significant challenge. While transformations existed between WGS84 & GDA94 and GDA94 & GDA2020, there existed no direct path from GDA2020 to WGS84. If you wanted to place GDA2020 data into WebGIS you had to transform you data back through GDA94 to WGS84. Effectively moving the data back to its old location prior to publishing. Many clients were ask edwhy????

It has been termed the WGS84 Projection dilemma. So what’s changing?

Well ICSM have been listening and over the past six to eight months have released a new set of transformations. These now enable direct transformations to WebGIS. These are as follows:

EPSGNameType / description
1150GDA94 to WGS84 (1)Null Transformation to WGS84 ensemble.
Approximation at +/- 3m asing assumption that GDA94 is
equivalent to low accuracy WGS84 (ensemble)
9688 – NewGDA94 to WGS 84 (2)[Non-Null] 7 parameter transformation:
Equivalent to 8048 plus (null) 8450
9689 – NewGDA94 to WGS 84 (3)[Non-Null] NTv2 Conformal & Distortion:
Equivalent to 8447 plus (null) 8450
8450 – New
to ArcGIS
GDA2020 to WGS 84 (2)Null Transformation to WGS84 ensemble.
Approximation at +/- 3m using assumption that GDA2020 is
equivalent to low accuracy WGS 84 (ensemble)
9690 –  NewWGS 84 to GDA2020 (3)[Non-Null] 7 parameter transformation:
Equivalent to 8048 plus (null) 1150
9691 – NewWGS 84 to GDA2020 (4)[Non-Null] NTv2 Conformal & Distortion:
Equivalent to 8447 plus (null) 1150

So what does this mean to the ArcGIS user?

Well you can now hold the majority of your data in GDA2020 and share it to Web GIS and have GDA94 data transformed to WebGIS and it all aligns.

So if the majority of you data is held in GDA2020 then us use:

NameTypeEPSG
GDA2020 to WGS84Null Transformation to WGS84 ensemble8450
GDA94 to WGS84 (2)[Non-Null] 7 parameter transformation:
Equivalent to 8048 plus (null) 8450
9688
GDA94 to WGS84 (3)[Non-Null] NTv2 Conformal & Distortion:
Equivalent to 8447 plus (null) 8450
9689

If you continue to hold most of your data in GDA94 then use:

NameTypeepsg
GDA94 to WGS84Null Transformation to WGS84 ensemble1150
GDA2020 to WGS84 (3)[Non-Null] 7 parameter transformation:
Equivalent to 8048 plus (null) 1150
9690
GDA2020 to WGS84 (4)[Non-Null] NTv2 Conformal & Distortion:
Equivalent to 8447 plus (null) 1150
9691

When will the new transformations be available in the ArcGIS System?

ArcGIS Pro – Version 2.8 – Mid May 2021

ArcGIS Enterprise – Version 10.9.1 – Late Q4 2021

Note: ArcGIS Enterprise 10.9 does NOT have these transformations. Due May 2021

For further information this content was delivered in a webinar with Geoscience Australia, for which the recording can be found at:

Building better alignment: GDA2020 transformations for Web GIS

Getting started with credit management in ArcGIS Online

$
0
0

As the administrator of an ArcGIS Online organization, you have the ability to review your organization’s subscription details and credit status, manage members and licenses, monitor activity, generate usage reports and configure settings. Understanding and managing your organization’s credits may be new to you; but there is a wealth of resources available to help you navigate this task.

This article aims to provide you with a step-by-step guide of these key resources, to point you in the right direction, and ultimately get you started with managing credits in ArcGIS Online.

Step 1. Understand credits

In order to effectively administer your organization, you need to understand what credits are, and how they are used. In a nutshell, credits are currency across ArcGIS; they may be consumed during certain processes or transactions, storage scenarios, or when undertaking certain analysis processes, for example.

There are a number of excellent resources aimed at both helping you understand which actions consume credits, and at helping you estimate the number of credits your organization may require:

It is also important to note that some processes consume more credits than others. For example, some commonly used workflows, such as Imagery Storage, Geocoding, and ArcGIS GeoEnrichment Services, consume more credits than most other processes.

Step 2. Manage credits with credit budgeting

Now that you know what credits are, and how they may be consumed, you may now wish to consider credit management strategies for your ArcGIS Online organization.

To do this, you first need to know: 1) your estimated usage [see Step 1 resources to help estimate your credit usage], and 2) how many credits your organization currently has.

You can obtain your current credit status by doing the following:

  • Sign in to your ArcGIS Online organization using your administrator credentials [via arcgis.com].
  • If necessary, click the Organization tab.
  • If necessary, click the Overview tab [underneath the Organization tab].
Overview Tab in ArcGIS Online.
The Overview tab is located under the Organization tab.
  • Inspect the Credits window on the right-hand side of the page to find your Total remaining credits.
The Credits Overview window provides a basic summary of total remaining credits and recent usage.

Once you have identified the current credit status of your ArcGIS Online organization [i.e., Total remaining credits], you may wish to implement credit budgeting.

There are a number of ways to manage an ArcGIS Online organization’s credit budget. For example, you may wish to manage the roles of your members in order to restrict access to credit consuming tools to only those who need them; or you may wish to enable credit budgets for your members.

You can enable credit allocation in the following way:

  • Sign in to your ArcGIS Online Organization using your administrator credentials.
  • If necessary, click the Organization tab.
  • Click the Settings tab [underneath the Organization tab].
The Settings tab is located under the Organization tab.
  • On the left-hand side, click the Credits tab.
  • Toggle the relevant button to enable credit budgeting tools.
Enabling credit budgeting in ArcGIS Online.

The following resources will help you to navigate credit budgeting:

Step 3. Manage credits with monitoring and usage reports

A key part of managing your ArcGIS Online organization’s credits is monitoring usage. An ArcGIS Online administrator can obtain a snapshot of usage in the Credits section of the Overview tab in ArcGIS Online. However, more advanced monitoring and reporting tools are also available via the status dashboard.

To view the status dashboard:

  • Sign in to your ArcGIS Online Organization using your administrator credentials.
  • If necessary, click the Organization tab.
  • If necessary, click the Status tab [underneath the Organization tab].
The Status tab is located under the Organization tab.
  • Ensure Dashboard is selected underneath the blue bar with the Status tab active.

From here, you will encounter a selection of tabs: Credits, Content, Apps, Members, and Groups. There is also an additional Reports tab, next to the Dashboard tab.

The following resource steps through each of these tabs, and outlines how you can use them to monitor and report credit usage:

Step 4. Purchasing additional credits

If you find that your organization has used more credits than were available [i.e., you now have a negative credit balance], that you require more credits than initially estimated, or that are coming close to exhausting your existing credits, you may wish to purchase additional credits.

You can purchase additional credits here:

Step 5. Additional training for ArcGIS Online Administrators

There are a number of training options available to help you prepare for administering an ArcGIS Online organization:

Next Steps: Administering an ArcGIS Online Organization

You may wish to explore the following resources for further help, tips, and tricks for administering your ArcGIS Online organization:

Which ArcGIS Online items are consuming the most credits through storage?

$
0
0

As your ArcGIS Online organization grows, so does the amount of content, and subsequently the credit consumption to store it. It is important for Creators to understand which types of items consume storage credits at a higher rate, and for administrators to identify which users and items are incurring the highest usage.

Understanding credits

Credits are the currency used across ArcGIS and are consumed for specific transactions and types of storage. As this blog post specifically looks at item storage, I would encourage readers new to ArcGIS Online and credits to review the resources below to better understand their application more broadly:

Credits used for storage

The ArcGIS Online help documentation lists credits by capability, including the different storage rates based on the item:

ArcGIS Online > Understand Credits > Credits by capability

Storage costs are associated with size. The rates are shown per month and calculated hourly to account for changes as content is created. The documentation goes into more detail but we can see different item types incur different rates to reflect the way they are stored in the ArcGIS Online backend (database storage is more resource intensive than file).

What we can see is that there are essentially two cost rates depending on the storage type:

2.4 credits per 10 MB stored per month, calculated hourly:

  • Feature storage. e.g. a Hosted Feature Layer. (excluding feature attachments i.e. photos)

1.2 credits per 1 GB stored per month, calculated hourly:

  • Feature attachments
  • Feature collections
  • Features associated with location tracking
  • imagery storage
  • All other content except for hosted feature layers and content in ArcGIS notebooks.

Loosely speaking this means it costs significantly less per mb to store content that is not a Hosted Feature Layer (excluding size from their attachments, such as photos). It can also help in identifying which items are incurring more credits than others as the storage type will be reflected in ArcGIS Online usage dashboards and reports.

How many credits are being used daily for storage in my organization?

ArcGIS Online administrators can explore credit utilization by going to their Organization > Status page, pictured below. There are tools available to export this summary or define the usage period.

The Credit Utilization Summary allows us to view daily and period based consumption of credits.

Observing the photo above we can identify that approximately 20 credits are being consumed daily for storage (green bars). There are a few days where we have consumed credits through Analysis (blue bars) but this is relatively low. If they were higher we could explore the usage by interacting with the graph.

Scrolling down the page we then see a Usage Aggregation by type.

Usage Aggregation by Type. We can see that storage is the relatively largest consumer of credits for this organization.

By clicking on the Storage (green) section of the Chart, we can get a more detailed breakdown of the credit utilization based on type:

Storage Usage Chart. We can now see that Feature Storage uses the most credits relative to other storage types, such as file or tile.

For Feature Storage we can bring up a report by clicking again on the chart, selecting Standard Feature Data Store in the list and clicking View item details:

Note that the credits per item are not shown as rates are based on total database storage values. We can still infer the relative costs based on the size e.g.:

  • The largest Feature Storage item is 413mb. At 2.4 credits per 10mb monthly, this item would incur approximately 99 credits a month.
  • From the dashboards we can identify that feature storage accounts for approximately three quarters of all storage. The Standard Feature Data store usage is currently 2.45gb. The largest 5 items are 100mb to 400mb each or 1.04gb together, accounting for nearly half of the feature storage consumption.

By exploring the credit status dashboards we have now identified which capabilities (storage) are incurring the most credits, and then further narrowed it down to a few items and their owners. You could take a similar approach to explore other credit capabilities, or define particular date periods.

Are these items being used or just taking up space?

Moving from the Credits status dashboard to the Content Dashboard, we can explore how members are creating, using, and sharing content. The charts, tables, and map support drill-down interactions that allow you to refine the details. Adjust the time at the top of the app to change the time period. You can see content activity up to the past 12 months. The default is two weeks.

Using this dashboard I can search for the largest item or owners and see its usage

We can also navigate to the item directly in ArcGIS Online by searching for it, managing the members items (requires admin privileges) or by clicking the URL from a report.

The Usage tab on the Item Details shows the number of requests against this service

We can now identify that this item is using 99 credits a month in storage, was created in March, has not been used much since, and subsequently reach out to the owner to discuss potential removal.

I would generally advocate touching base with the item owner – and backing it up offline – before removing anything to ensure that live content is not inadvertently deleted! This is where good content management helps. Items with metadata, thumbnails and clear naming conventions help administrators understand the items purpose and usage.

Generating reports

The Feature Storage Details report from earlier has a quick link to download a CSV with some useful information – dates, owner, name, size.

We can also create Reports by going to Organization > Status > Reports > Create Report. There are a few useful reports we can create, including Activity, Members and Credits. To identify which items are the largest – and consuming more credits through storage – we can generate an Item report.

Credit consumption is calculated by the total organization size, so we won’t see a credits field in the output CSV. We can infer the approximate cost from the size of the item. Remember there are different rates for different item types – Hosted Feature Layers will consume approximately 100x more credits per mb than files.

The below documentation page gives more information on the fields generated in Item and other Status reports:

ArcGIS Online help > Report Fields

Best practice, budgeting tools and further reading

Three great ways to start on top of credits in ArcGIS Online are to:

  • Enable Credit budgeting per user
  • Work with users:
    • Create custom member roles with privileges to limit access to credit consuming tools
    • Educate the users on how credits are consumed. Privileges can then be provided to users who have demonstrated understanding.
  • Monitor organizational usage as explored in this blog

For more information on credits and best practices:


FAQ: What is the correct workflow to achieve a full compress in a versioned geodatabase using replicas?

$
0
0

Question
What is the correct workflow to achieve a full compress in a versioned geodatabase using replicas?

Answer
To achieve a full compress in a versioned geodatabase (that is, move edits from the Adds and Deletes tables to the business tables, and remove unreferenced states), perform the following workflow:

  1. Disconnect all users/services including stopping ArcGIS Server services. This operation is best performed when there are no users connected, that is, outside of normal working hours.
  2. Reconcile/post all child versions to the Default version.
    If Using Replication: Do this on both child and parent geodatabases.
  3. Delete child versions. These versions can be recreated after the full compress has been performed.
  4. If Using Replication: Check and compare if there are any schema changes in either geodatabase.
  5. If Using Replication: Synchronize replicas from the child to the parent geodatabase (receive changes from the relative replica geodatabase to this geodatabase).
  6. If Using Replication: Compress child geodatabase. This will do a full compress on the child geodatabase and set SDE_versions.state_id to 0 (or Versions.state_id to 0) for the DEFAULT version.
  7. If Using Replication: Synchronize replicas from the parent to the child geodatabase (send changes from this geodatabase to the relative replica geodatabase). Even if no changes have been made this will push the Sync_Receive Version over to the child replica and allow a full compress on the parent geodatabase.
  8. Recalculate Statistics and Rebuild Indexes only on the delta and system tables. (Refer to the Versioning Vocabulary for an explanation of “delta tables”.)
  9. Compress parent geodatabase, and notice a full compress is accomplished. The state_id of the DEFAULT version is set to 0 in the SDE_versions table (or Versions table).
  10. Recalculate Statistics and Rebuild Indexes because the delta, base, and system tables record counts have likely changed since the last compress. (Refer to the Versioning Vocabulary for an explanation of “delta tables” and “base table”.)

Note:
If the ReplicaID of any synchronization versions do not appear in the GDB_REPLICALOG table they are orphaned synchronized versions and should be deleted. For example if 57 does not appear as a ReplicaID in the GDB_REPLICALOG table, but there are synchronization versions referring to replica 57 (for example SYNC_RECEIVE_57_0 and SYNC_RECEIVE_57_1) then these synchronization versions can be deleted.

References:

The compress operation and geodatabases

Compress (Data Management)
How To: Effectively compress a geodatabase with replicas
How To: Compress a versioned database to state 0

Compressing a versioned geodatabase is discussed in more detail in the course: “Implementing Versioned Workflows in a Multiuser Geodatabase”.

Versioning Vocabulary

Esri Basemaps – July update for Queensland

$
0
0

The Esri basemaps have been refreshed with a range of authoratative datasets across the state of Queensland. A big thank you to the following contributors:

  • QTopo – Department of Resources
  • Queensland Parks and Wildlife Service and Partnerships – Department of Environment & Science
  • Moreton Bay Regional Council

If your organisation would like to participate in the basemap contribution process feel free to reach out to me on LinkedIn.

To check the basemap updates, please refer to this sample app, but the updates should appear in ArcGIS Pro/Online/Enterprise by default.

Some numbers:

Some rough numbers about this update:

  • Over 8000 ovals, soccer pitches and other sports fields
  • Over 270 Golf Courses
  • Over 460 cemetries
  • Over 29k buildings
  • Over 7000 km2 of restricted Military Areas
  • Over 90,000 km2 of National Parks
  • Over 30,000 km2 of State Forests
  • Over 37,000 km of streams & rivers (not counting the intermittent ones, canals or ditches which are included as different symbols)
  • Over 4500 km2 of Swamps
  • Over 13,700 km of Railway Track
  • Updated entire coastline including sand areas.
  • Updated Bays
  • Many other layers!

QTopo – Docks and Piers – Manly
QTopo – Railways and shunting yards – Jilalan Rail Yard
QTopo – Updated Coastline, beaches and estuaries

QTopo – Mangroves & Swamps (crocs!)
New Esri Topo / Prior Esri Topo / QTopo / Aerials
QPWS – National Parks, State Forests and Open Spaces
QTopo – Waterbody contributions by type (SUM of AREA)
Image
QTopo – Updated coastline, and working with Esri QA team to explain that Australia has roads that run along intertidal beaches!

Moreton Bay Regional always do an amazing job of keeping their local map current and up-to-date with complimenting the State data with some finer grained details.

This update they have refreshed their trees, parks, roads and parcels. Some xamples below…

MBRC – Trees around the golf courses
MBRC – Detailed line work on the sports fields

THe HERE data plays an important role in the Esri basemaps for Australia. This has been refreshed across Australia to the HERE Oceania 2021 Q2 vintage.

If you are not seeing these new updates, it is possible you might still be using the older raster tiled basemaps. These are in mature support and you should move to updating your organisation to use the Vector basemaps. More info here.

Stay tuned for more Australian updates into the Esri Living Atlas and Community Basemaps.

Determining the interdependencies of items in Portal for ArcGIS

$
0
0

With almost any Portal there comes a time when you have dozens of items, created over time by different people, and you may be looking to perform a bit of a clean-up.

The problem now arises that you do not know if the Web Map made by a colleague, who since left the organisation, can be deleted or if it is being used by any other items? You might find that deleting an insignificant-looking item brings your organisation’s most-used application down.

The best approach is to avoid ending up in this situation, by making sure your organisation has good conventions in place to leverage the following to keep your content structured and clean:

  • Tags
  • Categories
  • Delete Protection
  • Mark data as authoritative
  • Mark data as deprecated
  • Naming conventions
  • Folders
  • Groups
  • Thumbnails

Unfortunately, if you are already in the scenario of having dozens or hundreds of items, it can be very difficult to make sense of which items relate to others. The below Python script will assist in extracting the dependencies between items from your Portal and present them in an interactive HTML diagram. The script is written for Python 3.7.

It makes use of the following libraries that you may need to install into your Python environment:

  1. NetworkX
  2. MatPlotLib
  3. PyVis

To install these packages, use the pip installer to add them to your environment:

  1. Open command prompt and enter cd C:\Program Files\ArcGIS\Pro\bin\Python\envs\arcgispro-py3
  2. Run pip network
  3. Run pip matplotlib
  4. Run pip pyvis

Once these have been installed, copy the below script into your Python IDE of choice.

Modify the line

source = GIS(r’https://<machine fqdn>/<web adaptor name>’, ‘<portaladmin login>’, ‘<portaladmin password>’)

to reflect your Portal’s url and Administrator login. Administrator level is required to be able to list items that are owned by other users. Currently, ArcGIS Online does not support the item.dependent_upon() function which is required by this script.

Now when you run the script, you should get an output like below which graphically shows the different items in your Portal and their relationships to each other.

import arcpy
import requests

import pandas as pd
import networkx as nx
import matplotlib.pyplot as plt

from matplotlib.pyplot import figure
from urllib3.exceptions import InsecureRequestWarning
from pyvis.network import Network
from pyvis.options import Options

# Suppress only the single warning from urllib3 needed.
requests.packages.urllib3.disable_warnings(category=InsecureRequestWarning)

from arcgis.gis import GIS
from IPython.display import display


source = GIS(r'https://<machine fqdn>/<web adaptor name>', '<portaladmin login>', '<portaladmin password>')

pdSource = pd.DataFrame(columns=['source','dependent_on'])
guidMap = {}

source_users = source.users.search(query='', sort_field='username', sort_order='asc', max_users=100, outside_org=False, exclude_system=True)
arcpy.AddMessage(source_users)
print('User list: Role')
for user in source_users:
    print(user.username + "\t:\t" + str(user.role))
    arcpy.AddMessage(user.username + "\t:\t" + str(user.role))
for user in source_users:
    num_items = 0
    num_folders = 0
    print("Collecting item ids for {}".format(user.username))
    arcpy.AddMessage("Collecting item ids for {}".format(user.username))

    user_content = user.items()
    source_items_by_id = {}

    # Get item ids from root folder first
    for item in user_content:
        guidMap[item.itemid] = str.format("{2} \r\n {0} \r\n {1}", item["title"], item.itemid, item["type"])
        source_items_by_id[item.itemid] = item
        if (item.dependent_upon()['total'] > 0):
            print("\n\n Item: \t {2} \t\t\t id {0} is dependent on these items: \t {1}".format(item.itemid,item.dependent_upon(), item.title))
            for dependency in item.dependent_upon()['list']:
                if dependency['dependencyType'] == 'id':
                    pdSource.loc[len(pdSource)] = [item.itemid,dependency['id']]


    # Get item ids from each of the folders next
    folders = user.folders
    for folder in folders:
        num_folders += 1
        folder_items = user.items(folder=folder['title'])
        for item in folder_items:
            num_items += 1
            guidMap[item.itemid] = str.format("{0} ({1})", item["title"], item.itemid)
            source_items_by_id[item.itemid] = item
            if (item.dependent_upon()['total'] > 0):
                print("\n\n Item: \t {2} \t\t\t id {0} is dependent on these items: \t {1}".format(item.itemid,item.dependent_upon(), item.title))
                for dependency in item.dependent_upon()['list']:
                    if dependency['dependencyType'] == 'id':
                        pdSource.loc[len(pdSource)] = [item.itemid,dependency['id']]

    print("Number of folders for {} {} # Number of items checked {} ".format(user.username,str(num_folders), str(num_items)))

print(pdSource)

figure(figsize=(10,8))

G = nx.Graph()
G = nx.from_pandas_edgelist(pdSource, 'source', 'dependent_on')
G = nx.relabel_nodes(G, guidMap)

nx.draw_networkx(G, arrows=True, with_labels= True)

import json

options = {
  "nodes": {
    "font": {
      "size": 8
    }
  },
  "edges": {
    "color": {
      "inherit": True
    },
    "smooth": False
  },
  "layout": {
    "hierarchical": {
      "enabled": True,
      "direction": "LR"
    }
  },
  "interaction": {
    "hover": True,
    "multiselect": True,
    "navigationButtons": True
  },
  "physics": {
    "enabled": False,
    "hierarchicalRepulsion": {
      "centralGravity": 0
    },
    "minVelocity": 0.75,
    "solver": "hierarchicalRepulsion"
  }
}

net = Network(height="100%", width="100%")
net.set_options(json.dumps(options))
net.from_nx(G)
net.show("Dependencies.html")

FAQ: Can a feature service reference data from multiple data sources?

$
0
0

Data published as a feature layer must reference a single source geodatabase or database. You cannot publish data from more than one database connection in a single map.

In ArcGIS Pro, if you were to publish the data in a map as a map image and feature layer and there are multiple data sources referenced in the map you will get an error: ‘00062: Map contains data that does not use the same connection to an enterprise geodatabase’.

Web feature layers associated with a map image layer require that all layers and stand-alone tables in the service reference an enterprise geodatabase or a standard enterprise database using a single connection.

Data published only as a map service can come from multiple data sources. While it is possible to enable feature access on a map service after publishing, only the layers from a single data source referenced by the feature service would be accessible.

The requirement is further reiterated in the ArcGIS help documentation referenced from: https://enterprise.arcgis.com/en/server/latest/publish-services/windows/prepare-data-for-feature-services.htm

Sam P.

FAQ: How Can My Organisation Access ArcGIS GeoBIM Licenses?

$
0
0

ArcGIS GeoBIM licenses are currently an inclusion of ArcGIS Online ArcGIS Professional Standard and ArcGIS Professional Advanced user types.  You can read more on user types here.

If your organization does not have an ArcGIS Professional Standard or Advanced user type, GeoBIM can be purchased as an add-in license and then assigned to a compatible User Type, within your ArcGIS Online subscription. You can see more on how to manage licenses here.

If you would like to learn more about GeoBIM, please feel free to contact us

Does Portal inherit AD configured membership groups and will users be added to these groups upon login to Portal with their Enterprise Login?

$
0
0

Portal for ArcGIS may be configured for Enterprise logins (eg SAML/Active Directory).   An organisation may require their Portal content to be managed based on Active Directory Group membership.  The below answers the question “Does Portal automatically create groups to match Active Directory Groups and will users automatically be added to these groups when first logging in to Portal using their Enterprise Logins?”

The answer is yes, we simply need to configure portal groups and bind them to  the active directory group using the below steps.

Does Portal inherit Active Directory Configured Membership groups?
 
Portal for ArcGIS does not automatically create groups to match what is available in Active Directory.  The GIS Administrator will need to create and configure groups in Portal for ArcGIS for each of the Active Directory Groups that they want to allow membership of.
 
How to configure Portal to enable Enterprise Group Membership

User will need to Manually create the Portal Groups then bind them to the Active Directory Group

First, configure the organisation  SAML settings to enable SAML based Group Membership. This may be done via Organisations > Settings > Security >  Logins > Configure > Advanced Settings


You will then have the ability to create Portal groups with the setting “Enable SAML based group membership”


Here is where you will need to configure the enterprise group name.  This name may not be a recognisable name, it may be a group ID or SID.  Members will only be added to the group once they have logged in and if there is a group in the SAML assertion response which matches the enterprise group name.  


 Can SAML/Active Directory users be automatically added to configured Enterprise groups when signing into Portal?
 
Yes.  Once you have configured the Portal Groups and associated them with their respective Active Directory  groups you do not need to manage membership of those groups within Portal.  When a user logs in with  their enterprise account, the groups to which they are members in Active Directory is returned in the SAML response and ArcGIS reflects that by allowing the user membership to the matching groups you have defined. 

 Relevant resources

Use your portal with LDAP or Active Directory and portal-tier authentication https://enterprise.arcgis.com/en/portal/latest/administer/windows/use-your-portal-with-ldap-and-portal-tier-authentication.htm

Link enterprise groups from an IDP https://enterprise.arcgis.com/en/portal/latest/administer/windows/create-groups.htm#ESRI_SECTION1_5E3FFFAA1B7E443FBB1E483E070B1979

Esri Basemaps – October update for Tasmania (Part 1)

$
0
0

Thanks to Land Tasmania, we have started to bring some of their authoratative datasets (theList) into the Esri Basemaps.

This first iteration included:

  • National Parks
  • State Reserves
  • Forests
  • Ioenspaces
  • Local Parks
  • Sports Fields
  • Tennis Courts/Hardcourts
  • Golf Courses
  • Building Footprints
  • Refresh of the Parcels

A second iteration will focus in on additional layers such as the coastline, estuaries, hydrographic features and more. This will come at a later time.

Take a look at the Esri Basemap and do some zooming around Tasmania to see the new content. These basemaps support offline workflows if you require these basemaps in the field.

Pictures beat words here, so:

Devonport
Tasmania
Bridport
Geeveston
Triabunna

Prefer to change the styling? Want to remove labels or make the national parks bright purple? Go ahead and change the style to your hearts desire.

You can of course register the detailed basemaps from theList (several styles, and available as Esri REST endpoints) with your ArcGIS Online/Enterprise. This blog post has more information, but reach out in the comments if you need more info on how to achieve this.

If your organisation would like to participate in the basemap contribution process feel free to reach out to me on LinkedIn.


Using PowerShell to automatically find and package log files for ArcGIS Server, Portal for ArcGIS, and ArcGIS DataStore.

$
0
0

Have you ever submitted a support case and, as a part of the troubleshooting process, been asked to provide logs for one (or multiple) components of a base ArcGIS Enterprise deployment?

Esri provides documentation on where the default logging location is for various ArcGIS Enterprise components, but this is a user-configurable path.

Default Logging Locations

  • ArcGIS Server
    • C:\arcgisserver\logs – as per here.
  • Portal for ArcGIS
    • C:\arcgisportal\logs – as per here.
  • ArcGIS DataStore
    • C:\arcgisdatastore\logs – as per here.

Maybe you go to check these default directories and you find that the directory doesn’t exist, or that there aren’t any logs present? You ask yourself, “Am I working with an ArcGIS Enterprise environment that has had logging locations modified from its defaults? What’s the process for figuring out where the logs might be?

Depending on your enterprise configuration, as well as the enterprise component in question, there could be a number of places where the log files are being stored.

If you wanted to manually find the location for each component, you could:

ArcGIS Server

Go to ArcGIS Server Manager > Logs > Settings, and identify the value specified for “Log file path“.

Portal for ArcGIS

Go to Portal Administrator Directory > Logs > Settings, and identify the value specified for “Log Location“.

ArcGIS Data Store

  • Open a terminal (cmd, PowerShell, Windows Terminal) as administrator
  • Go to the “C:\Program Files\ArcGIS\DataStore\tools” directory*.
  • Run the “describedatastore” command and identify the value specified for “Log location“.

*Assuming you are using the default installation directory for ArcGIS Data Store.

The PowerShell alternative

Sure, checking those things manually works if you have a relatively simple environment that doesn’t regularly change. But what if you are in an organisation with multiple ArcGIS Enterprise deployments across different environments (e.g. test, dev, UAT, production)?

What if there was an easier way to automatically obtain the latest log file for ArcGIS Server, Portal for ArcGIS, or ArcGIS Data Store, and add to a ZIP file ready to share with whomever has asked for it?

Introducing, the suitably named, “ExtractLogFiles.ps1”!

Wait, what is “ExtractLogFiles.ps1“?

Written in PowerShell, the script has been designed to be run on a Windows machine running one or multiple base ArcGIS Enterprise components, automatically locate the most recent log file for one or more components, and to add them to a ZIP file in the current (or a user-specified) directory.

How does it work?

At a high-level, the script:

  • Determines the output folder to add the ZIP file (whether default or user-specified)
  • For each component specified, find the most recent log file by:
    • Using environment variables, determining the install location for the component
    • Finding a specific settings file which specifies the log file directory for the component
    • Access the log file directory and selecting the most recently written file
  • Copies the log file into the output folder for each component specified
  • Once all log files have been copied, add all logging files to a ZIP file, and delete the log file copies

How can I run it?

Download the following file to your local machine.

You can also read through the file in GitHub using the following link.

There are a number of parameters that are available to specify when running the script, such as:

.\ExtractLogFiles.ps1 -help -server -portal -datastore -datastorefolder "server" -destination "C:\Temp"

Running the script with “-help” provides details about each parameter and its usage.

For example (#1):

./ExtractLogFiles.ps1 -server -portal

Will copy most recent log file for Server and Portal and add to an output ZIP file within the current directory.

For example (#2):

./ExtractLogFiles.ps1 -server -portal -datastore -destination 'C:\Temp'

Will copy most recent log file for Server, Portal, and DataStore (from the folder specified during script execution) and add to an output ZIP file within the ‘C:\temp’ directory.

Because the “server” directory was specified for Data Store, the log file will also have “server” as its name. Something to look out for.


Potential issues you might run into

It’s at this time I would like to stress that this has been something written over a period of free time, and does not constitute ‘official’ software in any way that will be supported. Running this on any machine, in any environment, carries its own risk. It has been tested on Windows 10 machines running either ArcGIS Enterprise 10.9 and 10.8.1, but your mileage may vary.

The most common issue I anticipate running into will be when initially trying to run the script, due to the ExecutionPolicy setting in your organisation.

This is an error message you will receive if the ExecutionPolicy is set to “Restricted” .

The following documentation provides an overview of ExecutionPolicy in relation to PowerShell and steps on how to adjust. Please consider your organizations IT policies and standards before changing a setting such as this.

In addition, depending on error messages that appear during execution, some other things to potentially check are:

  • The account running the script needing appropriate permissions to the directory that the log files are in
  • The account running the script needing appropriate permissions to the output directory the ZIP file will be created in

Okay I have the logs, now what?

If you wanted to take a look at the logs yourself to understand what might be occurring within your environment, the following documentation pages may be helpful in building some initial context around logs in ArcGIS Enterprise:

Thanks for reading!

If you made it to the end, thank you for reading. Hope the above helps you when trying to search for log file directories, log files themselves, or has made you aware about the power of PowerShell!

Stay tuned for additional articles around how we can combine PowerShell scripting and ArcGIS Enterprise logging!

Working with Portal for ArcGIS authentication: Enterprise groups, the Portal Administrator Directory, and SAML

$
0
0

A brief background

When managing authentication with your chosen identity store in Portal for ArcGIS, authentication can be configured at the Portal tier, the Web tier, or the External tier. The primary differences from a user experience perspective being Portal tier requires credentials to be provided to sign in and it does not support a Single Sign On (SSO) experience. Web tier can be configured to utilise the ArcGIS Web Adaptor, Microsoft Internet Information Services (IIS), and Integrated Windows Authentication (IWA) for a SSO user experience.

If using an enterprise identity store with Portal tier authentication, by its nature it requires a closer integration with your Microsoft Active Directory (AD) or Lightweight Directory Access Protocol (LDAP) compatible identity store. When a user enters their credentials to the Portal for ArcGIS sign in page, the credentials are passed to the portal application which then handles the process of authenticating the credentials with the configured enterprise identity store before signing them in.

If using an enterprise identity store with Web tier authentication, the ArcGIS Web Adaptor and IIS configured with IWA enabled handle the authentication of credentials rather than the portal application, enabling a SSO experience. It can also be configured with the Java ArcGIS Web Adaptor and LDAP, for utilisation in a Linux environment for example.

Becoming a popular option, Portal for ArcGIS supports integration with identity providers compatible with Security Assertion Markup Language (SAML) 2.0 authentication, a form of external tier authentication method. Similar to web tier, authentication is handled on a web server but usually an external web server to the ArcGIS Enterprise deployment. Common scenarios include the utilisation of external identity providers such as Microsoft Azure Active Directory, Microsoft Active Directory Federation Services (ADFS), Okta, and others. Comparative user experiences would include utilising a Google, Facebook, Apple, or GitHub account to sign in and access other websites or services such as ArcGIS Online.

SAML is becoming a popular and prevalent security setting for Portal for ArcGIS due to the various security benefits, enabling a seamless Single Sign On (SSO) experience, and the ability to support multiple identity providers (both built-in and enterprise accounts).

Implications of SAML on the Portal Administrator Directory

Let us assume we have set up our Portal for ArcGIS with SAML authentication to an external identity provider. We have our enterprise users and groups configured as per Configure a SAML-compliant identity provider with a portal—Portal for ArcGIS | Documentation for ArcGIS Enterprise. Now we are looking at how we can interact with our enterprise users and groups through the Portal Administrator Directory endpoint. However, attempting to utilise the “Get Enterprise Groups for Users” operation through <portalurl>/webadaptor/portaladmin /security/groups returns error code 500: ” An enterprise group may not have been configured or we were unable to connect to it. Please check the logs for more information.”

We also attempt to use a Python script to automate the process of adding SAML users to portal, we are using an administrator account but the Generate Token request to the ArcGIS REST API still returns a 400 error! What could be the reason for all these errors?

Why? Simply, this is expected behaviour by external tier authentication.

When we configure SAML authentication with our enterprise identity provider, login requests to portal are redirected to the external identity provider via SAML. Upon successful login the SAML response is used by Portal for ArcGIS as authorised and trusted credentials to sign in. The external identity provider cannot be integrated via SAML as the Portal for ArcGIS user store and group store configurations.

The “Get Enterprise Groups for Users” and “Get Users Within Enterprise Group” only operate on configured user and group store configurations. These back-end operations only work with portal tier and web tier authentication scenarios. It does not currently support external tier authentication configuration such as SAML.


The following conceptual workflow demonstrates how the login requests are managed between Portal for ArcGIS and SAML (Step 2).

Ref: ArcGIS Server and Portal for ArcGIS: An Introduction to Security (esri.com)

If we explore our Portal for ArcGIS security configuration through <portal url>/webadaptor/portaladmin/security/config we will see the group store configuration in our Portal for ArcGIS identity store are still set to “BUILTIN” type even though we have set up SAML enterprise logins.  Basically, Portal for ArcGIS defers users to the SAML identity provider and trusts the assertion provided on behalf of the user. Rather than the username / login being handled by the Portal for ArcGIS built-in identity store, it is handled by the SAML identity provider.

Groups and Users operation on the Portal Administrator Directory endpoint are designed to interact with enterprise authentication at the web tier and portal tier, where we need to update our Portal for ArcGIS identity store with LDAP or AD users and groups. With this configuration, we will need to update group store configuration directly, using the JSON text mentioned in the following link: Use your portal with LDAP or Active Directory and portal-tier authentication—Portal for ArcGIS | Documentation for ArcGIS Enterprise.


In this scenario our Portal for ArcGIS uses the Microsoft Windows AD as its group store identity. Therefore, the “Get Enterprise Groups for Users” and “Get Users Within Enterprise Group” operations will return a valid response. Step 4 on the following picture demonstrates conceptually how Portal for ArcGIS accesses AD or LDAP identity stores to authenticate the login requests.

Authors: Razi Mosadeghi and Gregory Hibbett

Reference and Relevant resources:

Portal authentication configuration—Portal for ArcGIS | Documentation for ArcGIS Enterprise

Configure a SAML-compliant identity provider with a portal—Portal for ArcGIS | Documentation for ArcGIS Enterprise

Create groups—Portal for ArcGIS | Documentation for ArcGIS Enterprise

Use your portal with LDAP or Active Directory and portal-tier authentication—Portal for ArcGIS | Documentation for ArcGIS Enterprise

Configure Azure Active Directory—Portal for ArcGIS | Documentation for ArcGIS Enterprise

Tutorial: Azure Active Directory integration with ArcGIS Enterprise | Microsoft Docs

Does Portal inherit AD configured membership groups and will users be added to these groups upon login to Portal with their Enterprise Login? | Esri Australia Technical Blog (wordpress.com)

Going vertical in ArcGIS

$
0
0

With the integration of 2D Maps and 3D Scenes in ArcGIS Pro, coupled with broader use of high-accuracy GNSS, there is a growing need to consider vertical datums when working with GIS data. This blog seeks to unpack some key ideas around vertical datums within an Australian context, as well as provide some example workflows you might utilise when working with z-enabled data.

Put simply, a vertical datum defines the origin for height or depth values in ArcGIS. Let’s first look into some key terms which we might see when working with vertical datums – ideas which are discussed in further detail here:

Ellipsoid and Spheroid

               These terms are used interchangeably in the geospatial community; however, the spheroid is the preferred term in Esri documentation and will be used in this article. A spheroid is a mathematical representation of the earth, selected for use in a specific geographic area. This representation is based on a sphere, with a flattening applied to represent the ‘bulge’ in the earth at the equator.

Datum

               A datum incorporates the spheroid and provides parameters that define the origin of the spheroid with reference to the earth. If the spheroid is the ‘size and shape’, then the datum is its ‘position’.

Geoid (and AusGeoid)

               A geoid is a complex surface applied to the spheroid to provide a better approximation of heights on the surface of the earth. The geoid-corrected heights are often referred to as orthometric heights. A geoid allows for the calculation of orthometric heights by applying the geoid-ellipsoid separation (or N) to the spheroid height (see diagram below)

We use AusGeoid2020 to better approximate orthometric elevations in Australia for Mean Sea Level or Australian Height Datum (AHD). AusGeoid2020 is currently the best determination of AHD from GDA2020.

Vertical Datums and Transformation in ArcGIS – FAQ

Why do we need vertical datums and transformations?

When working with z-enabled data describing elevations, it’s necessary to define the datum so that others’ working with the data are aware of the reference point of those elevation values. Transformations are required because they provide an avenue to move between different datums. For instance, you may be provided with spheroid elevations in GDA2020 and may need to work on a project in AHD, referencing mean sea level in Australia. A vertical transformation using AusGeoid2020 allows you to transform these values from GDA2020 to AHD.

What is the coverage and accuracy of AusGeoid2020?

AusGeoid2020 has larger extents than the previous geoid, AusGeoid09, and now provides coverage of Australia and Indian Island Territories (Christmas Island, and Cocos and Keeling Islands). Esri’s stated accuracy of the vertical transformation from GDA2020 to AHD using AusGeoid2020 is 0.03m. It should be noted that the geoid has some distortions and biases which should be taken into consideration before applying this accuracy stated by Esri (more on that in this link).

How does ArcGIS Pro support vertical transformations to AHD?

A native install of ArcGIS Pro 2.8 does not include the AusGeoid2020 transformation. There is a vertical transformation in Pro (GDA2020_Height_To_AHD_Height_AUSGeoid2020 _1) which is included in the ‘ArcGIS Coordinate Systems Data’, the instructions to download this are included here.

Why are AHD and AHD Tasmania separate in the vertical datums list?

The leveling network to determine AHD was conducted on Mainland Australia independently of Tasmania. Therefore, there are two vertical datums available with the relevant extents for their area of coverage. The GDA2020_Height_To_AHD_Height_AUSGeoid2020 _1 transformation covers and will transform from GDA2020 to AHD within Tasmania, Mainland, and Island Territories. More information here.

Is the Australian Vertical Working Surface (AVWS) supported?

The Australian Vertical Working Surface (AVWS) is a new reference surface for heights in Australia. From ArcGIS Pro 2.9, the new Australian Vertical Working Surface is supported as a vertical datum. The new transformation GDA2020_To_AVWS_Height_2 provides avenues for transforming existing data to and from AVWS.

How do I transform between Spheroid/GDA2020 and orthometric/AHD in ArcGIS Pro?

Provided that you have correctly defined the vertical datum when creating or importing data in ArcGIS Pro, you can change the (vertical) Map Coordinate System and transformation to alter the height format used in the Map Frame. The vertical datum work in much the same way as the ‘on-the-fly transformation’ in the horizontal coordinates systems.

With this in mind, In ArcGIS Pro, we have two potential workflows.

Method 1: Transform On-the-fly: Take this example of a layer that was collected using Field Maps in GDA2020.

  1. Checking the layer properties in ArcGIS Pro, see that the vertical datum is GDA2020.
  2. In Map Properties (right-click) set the Map ‘current Z’ value to AHD.
  3. Specify the transformation (GDA2020_Height_To_AHD_Height_AUSGeoid2020 _1). Pressing OK will allow for on-the-fly transformation of the z values.
  4. Select a point, then select attributes -> geometry. The z value which is showing has now been corrected by the geoid-ellipsoid separation value and represents AHD.

Note: in this workflow, we only change the coordinate display, not the underlying coordinates stored in the layer.

Method 2: Reproject the layer: Note that we use the layer from the example above, as it still has the GDA2020 vertical datum applied

  1. Open the ‘Project’ geoprocessing tool to create a new layer with the vertical datum set to AHD.
  2. Select the input dataset or feature class, and output name.
  3. For the output coordinate system, select the vertical datum for the output layer to be created in (in this case, AHD).
  4. Check the ‘vertical‘  box to tell ArcGIS Pro to apply a vertical transformation to the coordinates.
  5. Specify the transformation path to link GDA2020 to AHD using the geoid (GDA2020_Height_To_AHD_Height_AUSGeoid2020 _1).
  6. Press Run.
  7. Examine the map properties to see that no on-the-fly transformation is applied, as the Map and Layer both exist in AHD.
  8. Select a point, then select attributes -> geometry. The z value which is showing has now been corrected by the geoid-ellipsoid separation value and represents AHD.

The ‘vertical’ checkbox in Project or Project Raster has an important function. If the box is unchecked, which is the default. The vertical datum will be written to the output dataset, but the data will not be transformed (a null transformation). However, with the ‘vertical’ box checked, the z values of the output data will be transformed using the selected transformation.

Can we just define projection to specify the vertical datum? Where does this fit in?

If the data has been added to a z-enabled layer without an unknown projection, you will need to use the define projection tool. If you run the Define Projection tool to AHD on a layer with GDA2020 elevations, you are not changing the underlying elevations, you’re just specifying the vertical datum of the data.

What about elevations in ArcGIS Online, or Portal for ArcGIS?

The scene viewer supports vertical datums. If you are sharing to ArcGIS Online or Portal for ArcGIS, the vertical datum will be taken from the scene properties and carried through to the published scene. There is an excellent blog that goes into this in more detail here. 

What do I do in Field Maps?

If working with data in Field Maps, you do need an awareness of the vertical datum and geoid that your receiver is using, as it will help you make decisions regarding vertical datums as you complete your fieldwork and processing workflow.

The way Field Maps records positions is from reading an NMEA stream of positions from the GNSS receiver interface (directly from your phone, Trimble Catalyst, Leica Zeno, or similar), the message contains both the Orthometric Height and the Geoid-Ellipsoid Separation which are read by Field Maps to deduce the elevation. See the example below.

A sample NMEA GGA message for Bendigo, Victoria.

$GNGGA,22437.77,3615.173353,S,13415.687886,E,1,12,0.6,250.2,M,3.9,M,,*59

250.2 is the Orthometric Height

3.9 is the Geoid-Ellipsoid Separation.

Field Maps currently only supports horizontal transformations, so the data collected should be in AHD (by applying a geoid in your GNSS receiver), or, you’ll need to collect in GDA2020, and apply the transformation after data collection at the layer level in ArcGIS Pro.

A potential issue is that most phones use EGM96, a global Geoid, rather than AusGeoid2020 – which is not critically important for some users, because the accuracy of the vertical position in a mobile phone is usually less than the difference between EGM96 compared to AusGeoid2020, but it’s something to be aware of as mobile devices continue to improve positional accuracy.

What about rasters?

Vertical datums and transformations apply to raster data too. The workflows are similar to what is described with vector data, however, a different Geoprocessing Tool, Project Raster, must be used to transform raster data between vertical datums.

Other resources:

GDA2020 and Ausgeoid2020 are just components of continually evolving methods for describing elevations in Australia. The following articles provide further information on the latest advances in datum modernisation.

https://www.icsm.gov.au/australian-height-datum

https://www.icsm.gov.au/australian-vertical-working-surface

ArcGIS Pro documentation on vertical coordinate systems: https://pro.arcgis.com/en/pro-app/latest/help/mapping/properties/vertical-coordinate-systems.htm

List of supported Vertical Coordinate Systems in ArcGIS Pro: https://pro.arcgis.com/en/pro-app/latest/help/mapping/properties/pdf/geographic_coordinate_systems.pdf

List of supported Vertical Transformations in ArcGIS Pro: https://pro.arcgis.com/en/pro-app/latest/help/mapping/properties/pdf/geographic_transformations.pdf

Developing & Licensing ArcGIS Runtime Applications, Demystifying the Requirements

$
0
0

If you’ve wondered about building an ArcGIS Runtime app and associated licensing requirements, navigating the abundance of ArcGIS Developer information, can be a little daunting. Coupled with this, is the January 2021 release of ArcGIS Platform, and the associated aspects that it brings to the table.

This post describes ArcGIS Runtime licensing and the developer’s requirements, for developing and deploying an ArcGIS Runtime application.

If you are new to Esri technology, the first thing you need to understand is what ArcGIS Runtime is. Simply put, ArcGIS Runtime is an Esri SDK product that allows developers to build standalone native applications for a variety of platforms and devices. As such, there are multiple different types of ArcGIS Runtime SDK available :
ArcGIS Runtime SDK for .NET
ArcGIS Runtime SDK for Android
ArcGIS Runtime SDK for iOS
ArcGIS Runtime SDK for Java
ArcGIS Runtime SDK for Qt
Depending on the platform that the developed application is to run on, the developer works with the corresponding Runtime SDK.

In order to license and deploy an ArcGIS Runtime application, there are two key items that must be considered :
1. Which ArcGIS Runtime functionality is to be used by the Runtime application ?
2. From where will the ArcGIS Runtime application access data and services ?
Foremost though, the developer will need to :
3. Access and download their ArcGIS Runtime SDK of choice.

The remainder of this post describes the above requirements and associated considerations. 

1. Access the ArcGIS Runtime SDK

First off, the developer requires access to their required ArcGIS Runtime SDK. To download and freely develop and test against any of the aforementioned ArcGIS Runtime SDKs, the developer needs to have an ArcGIS Developer Subscription (ADS).

A developer can sign up for a freely available ADS at https://developers.arcgis.com/sign-up/. They then gain access to https://developers.arcgis.com via their Developer account, and may subsequently download the required ArcGIS Runtime SDK, by navigating to the “Downloads” tab, from the Developers “Dashboard” page.

Note too, Developer Subscriptions are also available as purchased subscriptions; Irrespective of this, any type of ArcGIS Developer Subscription, free or purchased, will allow you to download and develop with an ArcGIS Runtime SDK *1.

*1 If you would like to know more about ArcGIS Developer Subscriptions, the types that are available, and the entitlements that they include, you may be interested in the further blog post : “The ArcGIS Developer Subscription : Varieties and Inclusions”

2. Which ArcGIS Runtime Functionality is to be Used by the ArcGIS Runtime Application ?

ArcGIS Runtime functionality is available at four different license levels : “Lite”, “Basic”, “Standard” and “Advanced”, as specified at https://developers.arcgis.com/net/license-and-deployment/license/#licensing-capabilities. These levels comprise capabilities that are cumulative, moving from the Lite level up to the Advanced level. The ArcGIS Runtime functionality used by a subject application will govern the required ArcGIS Runtime license level that the developer needs to acquire.

There are 2 ways that the license is granted on application initiation. Either :

  • via a license code, which is available at a “Lite”, “Basic”, “Standard” and “Advanced” level, and embedded within an application’s initiation code.

or

  • via a “Named User” login, for ArcGIS Online organisation members,  or ArcGIS Enterprise Portal organisation members.

2.1 License codes

If the application is utilising capabilities at just the “Lite” license level, the developer can obtain a “Lite” license code from the ArcGIS Runtime documentation, available by logging into the ArcGIS Developer’s website. That is, on logging in, go to the applicable ArcGIS Runtime documentation page topic : “License and Deployment” > “License”,and scroll down to the “License String” sub-heading, where the Developer account Lite license string may be accessed, as shown below.

Example link for iOS :
https://developers.arcgis.com/ios/license-and-deployment/license/#license-string
Example link for .NET :
https://developers.arcgis.com/net/license-and-deployment/license/#license-string
The “Lite” license level is free of charge, and may be used to deploy an unlimited number of ArcGIS Runtime applications.

For “Basic”, “Standard” and “Advanced” license codes, developers need to purchase ArcGIS Runtime deployment packs, which are purchased in bundles of “x” deployment licenses (Basic level deployment packs are purchased in bundles of 50 licenses; Standard level packs are purchased in bundles of 25 licenses, and Advanced deployment packs are purchased in bundles of 5 licenses.).
Each install of the subject application represents a single deployment. So, for example, if the developer expects that there will be 100 installs for a subject Standard level ArcGIS Runtime app, 4 Standard level deployment packs would need to be purchased.

Licensing via a license string is required when a subject application will be either permanently offline, or offline for periods greater than 30 days.

2.2 Named Users

User types defined within ArcGIS Online organisations and on-premises ArcGIS Enterprise Portal organisations may be used to license ArcGIS Runtime applications. Depending on the user type of organisation members, a varying Runtime license level is available, as defined in the below table.
Hence, named users logging into an ArcGIS Runtime application will be able to access coded functionality, corresponding with their user type’s Runtime license level.

Source : https://enterprise.arcgis.com/en/portal/latest/administer/windows/licensing-arcgis-runtime-through-portal.htm

3. From where will the ArcGIS Runtime Application access Data and Services ?

In terms of an ArcGIS Runtime application accessing data and services, if the data is hosted and shared publicly, and the service freely available, there is no cost implication.

Alternative to this, the application may be accessing secured services within either an ArcGIS Online organisation, or an on-premises ArcGIS Enterprise Portal organisation. – In this circumstance, members of the “organisation” login to the subject application using their “organisation’s” Named User account credentials. In this way, data and services are accessible via the same sharing constraints as if those members were logged into the subject organisation.

Similarly, if ArcGIS Online premium services are accessed by the application, credits are consumed on a per user basis, attributed against the Named user, and charged as credits to the organisation.

Further to the above, an ArcGIS Developers Subscription (free or purchased) makes available to the developer a suite of freely available data and services, also known as ArcGIS Platform “Location Services. These include ready-to-use services such as geocoding, routing, basemaps, spatial analysis and data hosting capabilities, thus giving developers a means of accessing spatial service capabilities that is independent of the need for further ArcGIS infrastructure (- an option that will likely be attractive for applications that do not sit atop large ArcGIS implementations).

Location Services are made available via a pay-as-you-go costing model that includes a generous monthly “free tier” of service usage, before charges apply; Permanent access tokens, known as API Keys are used to secure these services. API Keys, Location Services and the costing model are managed via the Developer’s subscription and the ArcGIS Developers website.

A Note About Revenue Generating ArcGIS Runtime Applications

Prior to the January 2021 release of “ArcGIS Platform”, developers writing revenue generating apps were required to have an ArcGIS Developer Subscription that was purchased.

The release of ArcGIS Platform though, saw changes in respect of revenue generating apps and Developer Subscription requirements. Essentially, a prime intent of ArcGIS Platform was to reduce the developer’s requirements in terms of developing and deploying applications written with Esri APIs and SDKs. That being said, ArcGIS Platform removed the requirement for revenue generating apps to have an associated purchased ArcGIS Developers subscription. Instead, a freely obtainable ArcGIS Developer Subscription may be used.

Summary

In summary then, there are potentially 2 payment points involved with developing and licensing ArcGIS Runtime applications :

If the application is using beyond the “Lite” level of ArcGIS Runtime capabilities, deployed applications must be licensed via a Basic, Standard or Advanced Runtime license. This license is supplied either  as a license code (purchased in a deployment pack) or via a named user account for users that are members of an ArcGIS Online Organisation or Enterprise Portal Organisation. – Named users gain a license to use a Runtime application at the Lite, Basic, Standard or Advanced level, via the user type that is assigned to them.

The license code option is required where the application is required to execute entirely offline, or offline for periods of greater than 30 days.
 

If the application is using data and services that are accessed via an API Key, managed through the developer’s ArcGIS Developer Account, the developer needs to pay for these data and services via a monthly “pay-as-you-go” model, *when* the free tier of allocated monthly data and services have been consumed. If, however, the application is using ArcGIS Online premium services or data content from an ArcGIS Online organisation or an ArcGIS Enterprise Portal, credits are consumed on a per user basis, as if the application user were working in ArcGIS Online or Portal.

ArcGIS Developer Subscriptions : What’s Included, What’s Not?

$
0
0

What is an ArcGIS Developer Subscription ?

The ArcGIS Developer Subscription provides developers with access to Esri API’s and SDKs, as well as developer tools and services that supplement the process of application development with Esri technology. As with numerous other Esri offerings, the developer subscription is available via a variety of plans, starting with the “Essentials” level. The Essentials developer subscription is obtained by signing up for a developer account at https://developers.arcgis.com/sign-up.  – This is a freely available Subscription, and provides the developer account holder with access to the inclusions outlined below.

Beyond the “Essentials” level, there are a further four purchasable ArcGIS Developer Subscription (ADS) plans available, each with increasing  inclusions, beyond those included with Essentials. These plans, in order of increasing  product inclusions, are : “Builder”, “Professional”, “Premium” and “Enterprise”. Inclusions are cumulative, meaning that each plan will include all entitlements specified in the level beneath it; So, as an example, all Professional inclusions will also be found amongst the Premium inclusions.


The key difference between a free Subscription and a purchased Subscription is that a purchased subscription comes with its own set of core, off-the-shelf Esri products, such as ArcGIS Pro or ArcGIS Enterprise (eligibility for which depends on the purchased level). The inclusion of such core products allows for the setting up of distinct Esri development and testing environments, where various workflow and deployment scenarios may be configured and evaluated.

ArcGIS Developer Subscription Inclusions

The ArcGIS Developer’s pricing page, “Building ArcGIS Solutions” tables the Developer Subscription inclusions, increasing from the “Builder” plan, through to the highest “Enterprise” plan. What though, of the distinction between free Essentials inclusions, and Builder inclusions? – Tabled below is an elaboration of the above “Building ArcGIS Solutions” link; It incorporates inclusions at the Essentials level, therefore providing a clear summary of distinctions between the free and purchased subscription levels.

In general, all ADS plans provide access to all Esri API’s, SDKs and app builders, excepting the ArcGIS Pro and ArcGIS Enterprise SDK’s which a developer would only require, should they already have licenses for ArcGIS Pro or ArcGIS Enterprise. The ArcGIS Developer’s Downloads page is used to access respective API/SDK download links.
There is also an evident distinction between the Essentials ADS and the Builder ADS, where a developer seeks to use App Studio and deploy developed apps via the Apple App Store, or Google Play. – This is not possible with an Essentials plan, but is possible for purchased ADS plans, where a “Developer” AppStudio license is provided.
Another notable difference, the Essentials subscription includes Esri Community support which comes in the form of access to various online Esri forums. Beyond this, more personal one-on-one support is available via “Esri Technical Support”; This though, is only available to holders of a purchased ADS.
Further, all purchased ADS plans include access to a distinct 5 member ArcGIS Online (AGOL) Dev and Test organisation, which exists for the purposes of emulating a production AGOL environment, and testing planned workflows. This is distinct from the single member AGOL account which comes with all developer subscription plans; This single member AGOL organisation could primarily be seen as a web GIS content creation and hosting facility.

In terms of accessing license files for core products provided under an ArcGIS Developer Subscription, Esri’s MyEsri user portal is used by the developer assigned to the subject ADS. Since these inclusions are only applicable to purchased ArcGIS Developer Subscriptions, using MyEsri in this way is not applicable to the Essentials level developer.

The concept of the ArcGIS Developer Subscription, where developers have access to a full suite of Esri product, for “dev and test” purposes at a heavily reduced price, has been around for many years; Some readers may even remember the “Esri Developer Network” which was a similar “predecessor” to the ADS. Esri developers will also likely know, the experience of the ADS holder is fundamentally based around tools and resources found within the ArcGIS Developer’s website : https://developers.arcgis.com.
Within the last 12 months though, the release of “ArcGIS Platform” saw the availability of many new capabilities for ArcGIS developers1, and consequently the ArcGIS Developer’s website was extensively overhauled to accommodate these changes. – This is the reason that https://developers.arcgis.com took on a very new appearance in late January of this year, and therefore, that ADS holders (whether holding a free or purchased subscription), had access to a whole a new world of ArcGIS developer-centric services and tooling.
1 : New capabilities that became available to ADS holders when ArcGIS Platform was released are denoted with an * in the below table.

ArcGIS Developer Subscription Inclusions, by Subscription :

Further to the above table, Esri core products (eg. ArcGIS Pro, ArcGIS Enterprise), ArcGIS user type extensions (eg. Utility Network), ArcGIS premium apps (eg. ArcGIS Collector), and extension products for ArcGIS Desktop and ArcGIS Enterprise  (eg. Spatial Analyst, GeoEvent Server) are *only* available to holders of purchased ArcGIS Developer Subscriptions, depending on the purchased level, the variation of which is listed here.

Summary

The ArcGIS Developer Subscription is accessible to all developers, making available a broad and sophisticated range of location based developer capabilities, APIs and tools. Location aware applications may take many forms – the ArcGIS Developer Subscription, by virtue of its 5 distinct “levels” of product inclusion, seeks to accommodate all these forms, as well as developers from varied backgrounds. If you haven’t already become involved, sign-up, dive in and have a go. It’s never been easier!

Viewing all 274 articles
Browse latest View live